How do stock markets trend during the American presidential cycle?

13/07/2023
There is a lesser-known cycle amongst cycle theories, which links the performance of stock market indexes to the US presidential elections.
In this theory, years are grouped into four categories: election years, post-election years, midterm years and pre-election years. It also distinguishes between whether the President is running for re-election or whether, on the contrary, he/she is leaving office.
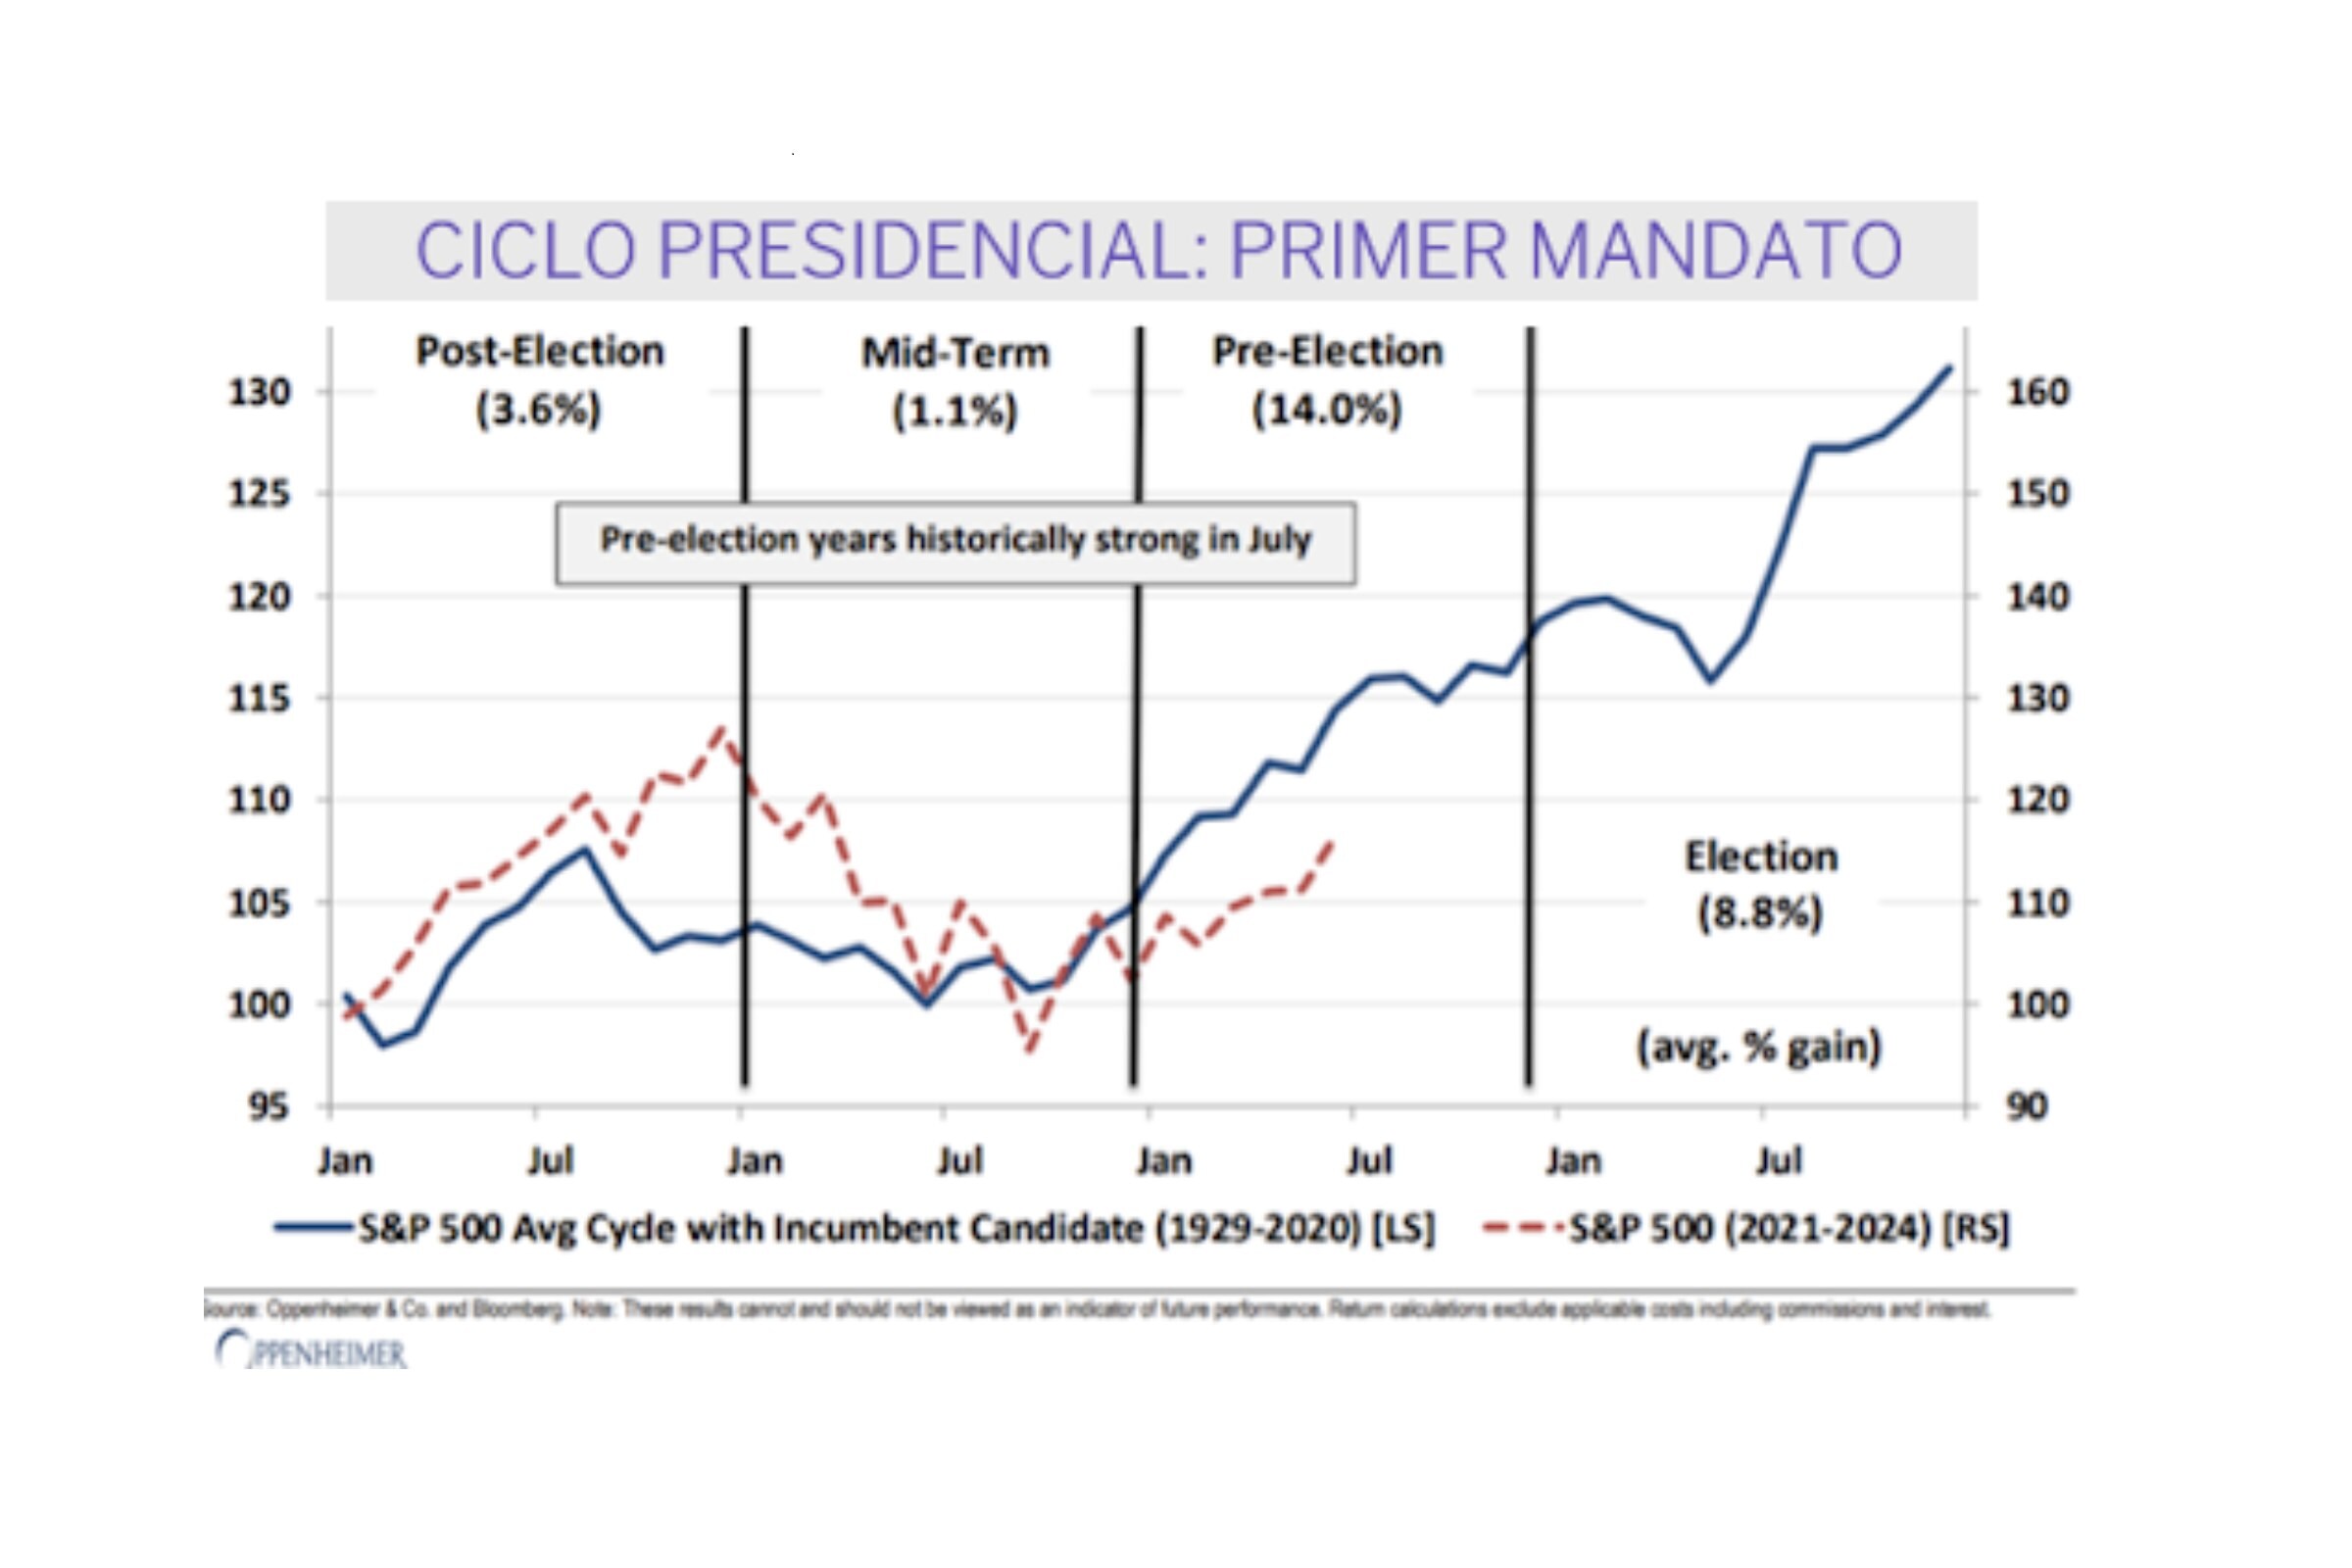
On this basis, pre-election years such as the current one are the best in terms of market performance, especially if the president hopes to be re-elected. An explanation of this result is that politicians try to avoid a recession at all costs, which would significantly limit their chances of being elected, and therefore tend to inject stimuli into the economy.
Election years are also usually positive years for the stock market, but with less consistency. On the other hand, post-election years and the so-called midterm years experience the worst market performance.
In the attached chart, prepared by Oppenheimer, we can see the average performance of the S&P 500 index since 1929, during first term election cycles (blue line). The red line, meanwhile, shows the performance of the index in the current presidential cycle. At the moment, it seems to be aligned quite closely with the historic standard.